站点图标 怎么做

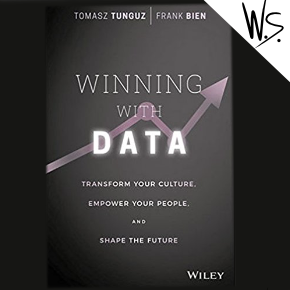
用数据取胜:改变您的文化、赋予您的员工权力并塑造未来

以数据取胜:总结与回顾

关键词: 分析、分析、业务、数据、指标、信息、基础设施、投资者、运营、启动

请注意: 本文末尾有指向其他评论、摘要和资源的链接。

书评

In today’s world, data is changing every industry. Data is the future, and companies that understand how to use it and operationalize it have a huge advantage over those that do not. To succeed in this rapidly changing environment, everyone in a company should have immediate access to the information they need to make the best decisions. 以数据取胜 提供有关公司如何通过数据战略分析继续发展和发展的建议。

The advent of cellphones has exponentially increased everyone’s need and desire for data. People expect data. They are used to having their questions answered immediately. In this data-rich environment, it’s important to avoid common biases and errors of perception. Within a company, data teams can be an important force for reducing bias and facilitating data literacy. The team should teach their colleagues to use data well; they should also help people learn to communicate about data more clearly.

Metrics can have a profound effect on process and reflect a company’s competitive edge, but that’s not the whole story. A company is more than its metrics. A company also needs well-defined values. And it needs the right people: people with intellectual honesty; people with curiosity; people who will use metrics to answer questions.

的合著者 以数据取胜 both have backgrounds in data-heavy industries. Tomasz Tunguz is a venture capitalist at Redpoint Ventures, and his blog promotes data-driven advice for startups. Frank Bien — an outspoken believer in teamwork and positive corporate culture — is the CEO of Looker, a business intelligence platform. Those who are interested in learning about the authors’ careers and how they came to this collaboration are advised to read the introduction.

Tunguz and Bien use plenty of examples taken from their own experiences and those of other well-known companies: Venmo’s use of data to improve their products; Warby Parker’s disruption of a multi-billion-dollar market; ThredUp’s ability to process thousands of items a day.

以数据取胜 提供建议,帮助公司在一个美丽的新世界中航行。作者对创建数据驱动公司的建议逐步分解,包括:创建通用词典;振兴团队文化;保持会议正常进行;并进行高质量的演示。这份非技术性概述充分解释了数据的战略使用如何为任何公司带来竞争优势。

概括

第1章

广告业务过去偏爱电视节目中描述的那种创造性方法 狂人.如今,数学比创造力更能推动战略。代替 狂人,广告专业人士是数学人:信息技术提供了开发活动的工具;算法指导决策;几乎所有的工作都是在计算机上完成的。自那以后发生了相当大的变化 狂人 天。

数据已经改变了广泛的不同领域,而不仅仅是广告。数据是未来,公司必须了解如何使用它并随之发展。

在拥有可操作数据的公司中,数据驱动着每个员工的行为。例如,优步没有库存;整个业务都是基于数据的。该公司比老式出租车公司更有效地调度司机,并通过可轻松识别问题司机的反馈系统保持高满意度。数据 = 可操作。

Instant data has become crucial, and the demand for instantaneous information is growing. We want our questions answered immediately (!). Because it used to take too long for people to get information in their company, data has historically been used as a tool to gauge past performance. Companies with good data infrastructure, however, can produce information and make decisions based on current metrics. These companies can ensure that data can get to where it needs to be, and in front of those who need it, — instantly. Inefficient supply chains (the people, processes, and programs that touch the data) result in slow data, where more people are seeking it than supplying it. This was a problem back in the day, but today, we are data rich and there is always more to be harvested.

然而,数据量使得对其进行排序比以前更加困难和耗时。小公司可能没有数据分析人员,创建和运行查询和报告可能会变得不堪重负。如果无法获得足够的数据,公司就会习惯于根据意见做出决策。这绝不是经营业务的最佳方式,这可能表明公司需要建立新的数据供应链。

一些企业有整个团队致力于确保数据的测量、描述和使用方式的一致性。他们辅导公司中的其他人,并授权他们创造性地使用数据。数据团队通过帮助每个人更好地了解如何使用数据而不是意见来推动公司发展,从而实现数据访问的民主化。

第2章

数据存在一些问题,这是我们这个时代的特征。

对词源好奇的人将有兴趣了解 Fleischmanns,捷克面包师,他们移民到美国并因今天仍在超市出售的烘焙酵母而闻名。 Fleischmann 一家每天都做面包,一天结束时他们总是会剩下一些,然后送给穷人。等待这个免费面包的人的队伍被称为 面包线.今天,数据贫乏的人有面包线。人们等待他们需要的信息就像穷人等待面包一样。一些数据请求被优先考虑;其他请求等待。数据面包线会导致多个问题:

  • 人们必须等待数据。这会减慢决策过程,进而拖慢公司的发展速度。
  • 人们会变得不耐烦,有时会在不等待数据的情况下做出决定。不知情的猜测很少会产生好的结果。
  • 关注面包线会消耗数据管理团队的精力,阻碍他们的潜力,并浪费他们的才能。

数据模糊也是一个问题。当数据杂乱无章时,响应时间和准确性会减慢。最终,公司可能会对其数据失去信心。

Data fragmentation is another problem. When people can’t get the data they need, they find a way to capture it and create their own databases. Rogue analysts and shadow databases often ignore normal validation and updating processes, keeping the information in silos.

Finally, data brawls create significant issues for companies. Data segmentation can create areas of misalignment. If there isn’t consistency in information, people start mistrusting each other’s point of view. They disagree; they argue; they fight. People in companies all need to be on the same page. They have to be using the same metrics and the same lexicon.

第3章

商业智能系统传统上分为三层:数据库存储数据;数据仓库从数据库中收集数据并进行聚合;和可视化层为最终用户格式化和呈现报告。这是一种陈旧的系统,因为每次提出不同的问题时,都必须为新报告编写新查询。

Back when they were a little startup, Google had vast amounts of data, but they couldn’t afford Oracle’s database fees. To get around this problem, they bought their own servers and distributed their data among them. The strategy worked, and, as I’m sure you are aware, Google is a model of data management today. The company has generated obscene amounts of data, and Google employees use this data for all kinds of research and analysis.

Data analysis is also taken seriously at Facebook, which has developed a number of different technologies to provide employees with access to data. One interface, HiPal, makes it easier for analysts to search for data. Users who aren’t familiar with SQL (Structured Query Language (SQL)) can do the same kind of analyses using these company technologies as one can with SQL. Other companies, like LinkedIn, use a similar data infrastructure.

Looker 是一种新型的数据接口。它创建了供整个组织使用的所有内容的单一版本,从而显着提高了数据完整性。

极端数据收集是新常态;所有大公司都有这些高性能数据库。它们非常快,存储便宜,并且有足够的空间和能力。鉴于这些进步,整个分析方法需要更新。可以积累大量信息,而精明的工人习惯于访问数据。他们需要复杂的工具来满足复杂的信息需求。使用工具越容易,使用它们的人就越多。

如今,有大量数据需要探索,人们可以自由探索。这是现代世界的数据结构。

关于数据技术历史的快速课程:该数据库是 1970 年由一位名叫 Edgar Cook 的 IBM 员工发明的。 Oracle Systems 成为数据库的主要开发商,并在他们的数据库中存储数据赚了很多钱。在 1990 年代,其他公司推出了使数据库更易于使用并最大限度降低数据库费用的软件。

第 4 章

通常,公司使用数据来查看过去发生的事情。新方法是操作数据并使用它来理解发生的事件。

Back in the day, clothes and fabric were expensive enough that even aristocrats bought used clothes. People called the Strazzaroli dealt in high-end used clothes. But as the industrial revolution ramped up, clothes got cheaper, and the Strazzaroli lost their means of living. Fast forward to a modern consignment company, The RealReal. They use real-time reporting to see what’s in their warehouse and how everything is moving in the value chain. Everyone in the company has access to the same information; everyone can react to the data in real-time. Design, marketing, finance, operations — e everyone can use instant information to benefit the company.

ThredUp 是另一家二手服装经销商。除了跟踪和处理商品外,ThredUp 还使用数据来预测在任何给定时间需要什么样的衣服。管理他们的数据帮助他们在启动后快速扩展。

Companies spend too much time on trivialities. Meetings eat up everyone’s time. This is lost productivity. The right data, however, reduces meeting time because it helps people focus on the right questions.

HubSpot 是营销自动化软件的提供商,它跟踪五个指标来评估其销售人员的绩效。销售人员可以访问他们自己的仪表板,查看他们如何朝着目标前进。前面讨论过的 Looker 还创建了一个工具来跟踪销售业绩。销售人员可以看到他们离完成配额还有多远,并监控他们正在准备的东西。客户服务解决方案提供商 Zendesk 使用 NPS 客户调查来生成数据,这帮助他们保持了可观的增长。

数据是任何成功的现代企业的重要组成部分。它在销售库存、响应客户请求、在适当的时间增加销售人员以及提高反应速度方面发挥着重要作用。

本章包含来自作者的丰富建议:

  • It’s important to have the same metrics across the company. Consider formalizing and standardizing using something akin to a data dictionary. You need to have a common lexicon.
  • Be brutally honest — or at least aim for that ideal. People shouldn’t be sensitive. Let go of your ego; accept criticism.

Decision making can be really arbitrary if it’s not backed up with data. The more information we have, the better decisions we make.

第五章

Curiosity is a basic human emotion and, according to the authors, the best way to transform a company’s culture into one that is data driven. Employees should be curious. They should have the ability to look up the information in which they are interested, and they should be able to test their hypotheses.

当一家公司被数据驱动时,可以预期会有一些文化转变:

  • 该公司开始使用数据来做出决策。
  • 公司从每个人那里获得最好的想法,而不仅仅是高管。
  • 公司鼓励实验和惊喜。

Experimenting is important. Demonstrating the value of experimentation, the authors discuss Intuit’s payroll management product, Paycycle. Product managers thought about putting in a feature enabling employers to cut checks immediately, but research indicated clients wouldn’t be interested in such a feature. They decided to test the feature anyway, and it ended up being surprisingly popular. The right culture starts with employees who are curious; it starts with people who ask questions.

Finding curious people is important, and it starts with the hiring process. But hiring interviews aren’t usually very informative. They can be rather haphazard. Instead, the authors suggest there should be a systematic process which could include determining desirable qualities in a candidate, crafting interview questions that address these qualities, and scoring candidates on the desired attributes. The candidate with the best score wins.

Recruiting metrics are useful to evaluate hiring practices — for example, the number of qualified candidates who pass a phone interview, the time from first contact with a candidate to signed offer, etc. To monitor satisfaction, you can survey candidates after interviews to see what they thought of the experience. Another important metric is the offer-acceptance rate (the percentage of people who accept job offers). Calculate your hires to goal by dividing the number of hires by the hiring goal.

At the end of the day, you want employees who will fit the company culture. But how do you measure culture? Use surveys and other tools to establish a dialogue between management and employees about the company. What are people’s goals? What do they like about the company? What feedback can they give? This process continues until the company values are crystallized and can be recorded.

Clarifying these pieces will make it easier for the interviewer to determine the extent to which a candidate’s values are a good fit. For example, if your company values high-quality customer service, you might ask an employee for an example of a time they helped a client.

谷歌在指标上比其他公司更进一步。他们绝对衡量招聘过程的所有方面,并为 HR 人员提供大量反馈。面试官通常会收到信息以提高他们的表现。

第六章

Once you have curious employees, expect that they’ll be asking questions, which starts the typical progression in data-driven companies:

  • 第一步:需要信息的人询问帮助创建和构建数据系统的工程师之一。随着公司的发展,这成为工程师的负担。
  • Step two: The team borrows a solution from somewhere else. People use software or other tools from another department or another company. Tailored for someone else’s data, this might not be a good fit.
  • 第三步:团队获取原始数据并编写自己的查询。

Twilio 有两种数据搜索器。一方面,数据团队对数据基础设施及其使用方法了如指掌。他们喜欢可以多次运行并交付给适当受众的报告。另一方面,公司的其他人想要一个简单的界面,让他们能够浏览数据。满足这两个截然不同的支持者是数据基础设施的一项关键任务。

另一个问题是 IT 采购权的分散。团队领导和部门越来越多地购买软件,从而将数据团队排除在外。 (这种对技术部门缺乏问责制被称为影子 IT。)供应商乐于为他们的管理客户提供服务并提供定制的解决方案,但这会导致数据碎片化,不同的部门和单位对真相有不同的看法。

数据团队需要转变数据架构,赋予用户更多权力。最终用户应决定使用哪些报告工具。数据团队的角色是支持基础设施,以便用户可以分析数据。云数据库应与本地公司数据库配合使用。

The data fabric — the matrix of information within the company — must be accessible to everyone, and one way to standardize it is through data modeling. Everyone in the company should use the same numbers and speak the same language. Consistency is so important. Scientists and engineers might understand the data architecture of a company, but not everyone else will. Data fabric makes the information available to all.

第7章

During World War II, a group of mathematicians and statisticians had secret meetings in New York where they analyzed military data and made recommendations to Washington (which were frequently followed). One of the guys on the team, Abraham Wald, had been asked by the Air Force to design armor for airplanes. Data from returning planes showed that most of the bullet holes were located around the tail gunner and the wings, so people thought these were the areas that should wear the armor. (The armor was heavy so they couldn’t just slap it on the whole plane. They had to be selective.) But Abraham Wald pointed out that the planes that had been shot in the wings were the planes that lived to tell the tale. The authors tell this story to illustrate the importance of avoiding data bias.

有许多潜在的陷阱、多种类型的数据偏差会阻止您理解数据:

  • Survivorship bias — Any time you cut data from your analysis, you risk distorted results. Correlation is not causation; just because two things seem to go together doesn’t mean that the one caused the other.
  • Anchoring bias — This occurs when someone suggests a value to you and it affects your own estimate. For example, if I ask whether Gandhi was over 114 when he died, your answer would probably be different than if I asked whether he was over 35.
  • Availability bias — If you see something happen or hear about how it happened from someone you know, it will seem like a lot more common an occurrence.

您可能会产生有效性的错觉,并相信收集更多数据将有助于预测未来,但有很多方法可能无法正确解释数据。当心。

Facebook 新员工参加为期两周的数据训练营,以提高数据素养。这为每个人讨论问题和机会提供了共同的背景。他们了解可用的工具和数据集。他们还有机会参与项目以扩展他们的知识。数据团队可以做很多事情来与员工会面并提高整个公司的数据素养。以这种方式处理公司文化是他们工作的重要组成部分。

第八章

描述性分析询问发生了什么;诊断分析询问原因。 (仪表板,在本书中受到诽谤,是描述性分析的接口。)

Descriptive and diagnostic analytics look at the past, while predictive and prescriptive analytics are about the future. Predictive analytics use historical data to predict future outcomes. Analysts can pose hypothetical “what if” questions to decide which path to take. Prescriptive analytics recommend the course of action based on the data. This requires lots of data and sophisticated analytics.

The Data Sophistication Journey is a model developed by Gartner, a marketing research agency. Data Sophistication maps a team’s evolution from descriptive to diagnostic analytics and from predictive to prescriptive analytics. But Gartner misses something between diagnostic and predictive analytics: exploratory analytics. This helps us find a hypothesis; this asks “why?” Confirmative analytics is used to determine if a hypothesis is true.

Data is only useful if you can act on it. Collecting data for no real reason serves no real purpose. On the other hand, you don’t always know what metrics will be actionable until after you’ve done an analysis. It’s good to have a balance.

Certain metrics are tried and true. The lifetime value of a customer (LTV) is an estimate of the total gross profit to be made from a customer over time. The cost of customer acquisition (CAC) is the total of all sales and marketing expenses averaged for one customer. The LTV/ CAC ratio indicates how efficiently a company pulls in revenue. But sometimes new metrics can be tailored to fit a situation, and creating new metrics can uncover new opportunities. The mMedia site Upworthy tracks various metrics to assess which factors make their content more popular, but they needed more information, so they invented a whole new metric to measure actual user attention (i.e., not accounting for those moments in which a web page open but the reader went to feed the cat). .

Design an experiment. Determine actionability. The data should relate to actual decisions that can be made. Bookend the expected results. Determine ahead of time the parameters of the experiment. Design the experiment. Develop a hypothesis. Decide on several different data points. Calculate the p-value. The p-value is the probability that the hypothesis is incorrect. Instructions for this calculation are provided. Plan to run the experiment. Figure out how long it will take. How many samples you need. Who will do the work, and how it will be structured. Don’t forget to include a control group to check results against. Run the experiment. Analyze the results. Compare them to the control group.

第九章

纽约市向公众提供了大量数据。一位名叫 Ben Wellington 的人开始分析数据,并在他的博客上报告了这些数据,包括绘制城市自行车事故图等内容。他变得非常受欢迎,他将自己的成功归功于他讲故事的能力。

Wellington’s lessons include the importance of making data relatable. Turn it into stories. (I tell my team this all the time!) Some people think data is kind of boring, and it isn’t enough by itself to inspire them. By making it a story, you give it emotional appeal. It is particularly important to be able to tell your story when you’re courting investors. Entrepreneurs pitching startups to investors need to show that they have identified a new opportunity — demonstrate urgency.

A standard method of communicating data is through presentations. Start by defining the goal of the presentation. What are you trying to explain? Are you trying to convince someone of something? Are you trying to sell something? Evaluate the intended audience. Investors are particularly interested in risk, so discussing these points shows that you understand the investor’s perspective. (There are many kinds of risk, see sidebar.) It’s important to develop the story arc. With your knowledge of the investors’ hopes and worries, create a storyline that addresses those concerns. Aim to keep it to ten 10 slides or less.

The presentation could begin with the company purpose or mission. Describe the problem. What is wrong that your product will solve? Then offer a solution to the problem. Explain what makes this a good idea right now, and why someone didn’t do it before. A demonstration of your product would be nice, but even pictures are good. Other important information to include in your presentation: market size, your team, business model, the competition, and financials.

Communicate your vision of the opportunity, and reinforce the vision with data. Provide a solution. Explain the company’s approach. Demonstrate how the market has responded. Engagement and acquisition metrics will be helpful here. It’s important to offer a good estimate of the market size. Venture capitalists totally want to know about this. How big of a potential market are we talking here? A discussion of the financials should at minimum include revenue, gross margin, and cash flow.

When you give the presentation, people will have questions. The more data you have, the better prepared you’ll be to answer those questions.

一些不同类型的风险:
Market timing risk — Is this the right time for this enterprise?
Business model risk — Do you have the right model for your product?
Market adoption risk — Will people use your new product?
Market size risk — Is your solution big enough to make a venture capitalist happy?
Execution risk — Does your team have the right skills for the job?
Technology risk — If new technology is developed, will it be finished on schedule?
Capitalization risk — Is there enough capital to go the distance?
Platform risk — Are there external partners outside your control?
Venture management risk — Is the company open to feedback?
Financial risk — Can the company keep paying the bills?
Legal risk — Are lawsuits or other legal issues looming on the horizon?

第 10 章:将所有内容放在一起
把它放在一起

一家公司可能会有很多摩擦。数据可以帮助减少这种摩擦。

People need to understand and expect data. People need to be intellectually honest; the decision-making process isn’t about ego. Let the best ideas win and don’t let politics affect the choice. A company needs well defined values. It needs the right people, it needs curious people.
为这个美丽的新世界武装企业的最佳方式是使用数据,而对数据的渴望越来越全球化。它确实正在改变每个行业。未来,操作数据将为企业提供成功所需的竞争优势。人们将立即获得做出最佳决策所需的信息。

指标可以对过程产生深远的影响。它们可以改善企业的运营方式,从而赋予其竞争优势。凭借统一的数据结构和优秀的团队,公司正在改变他们的行业。
退出移动版